TITLE:
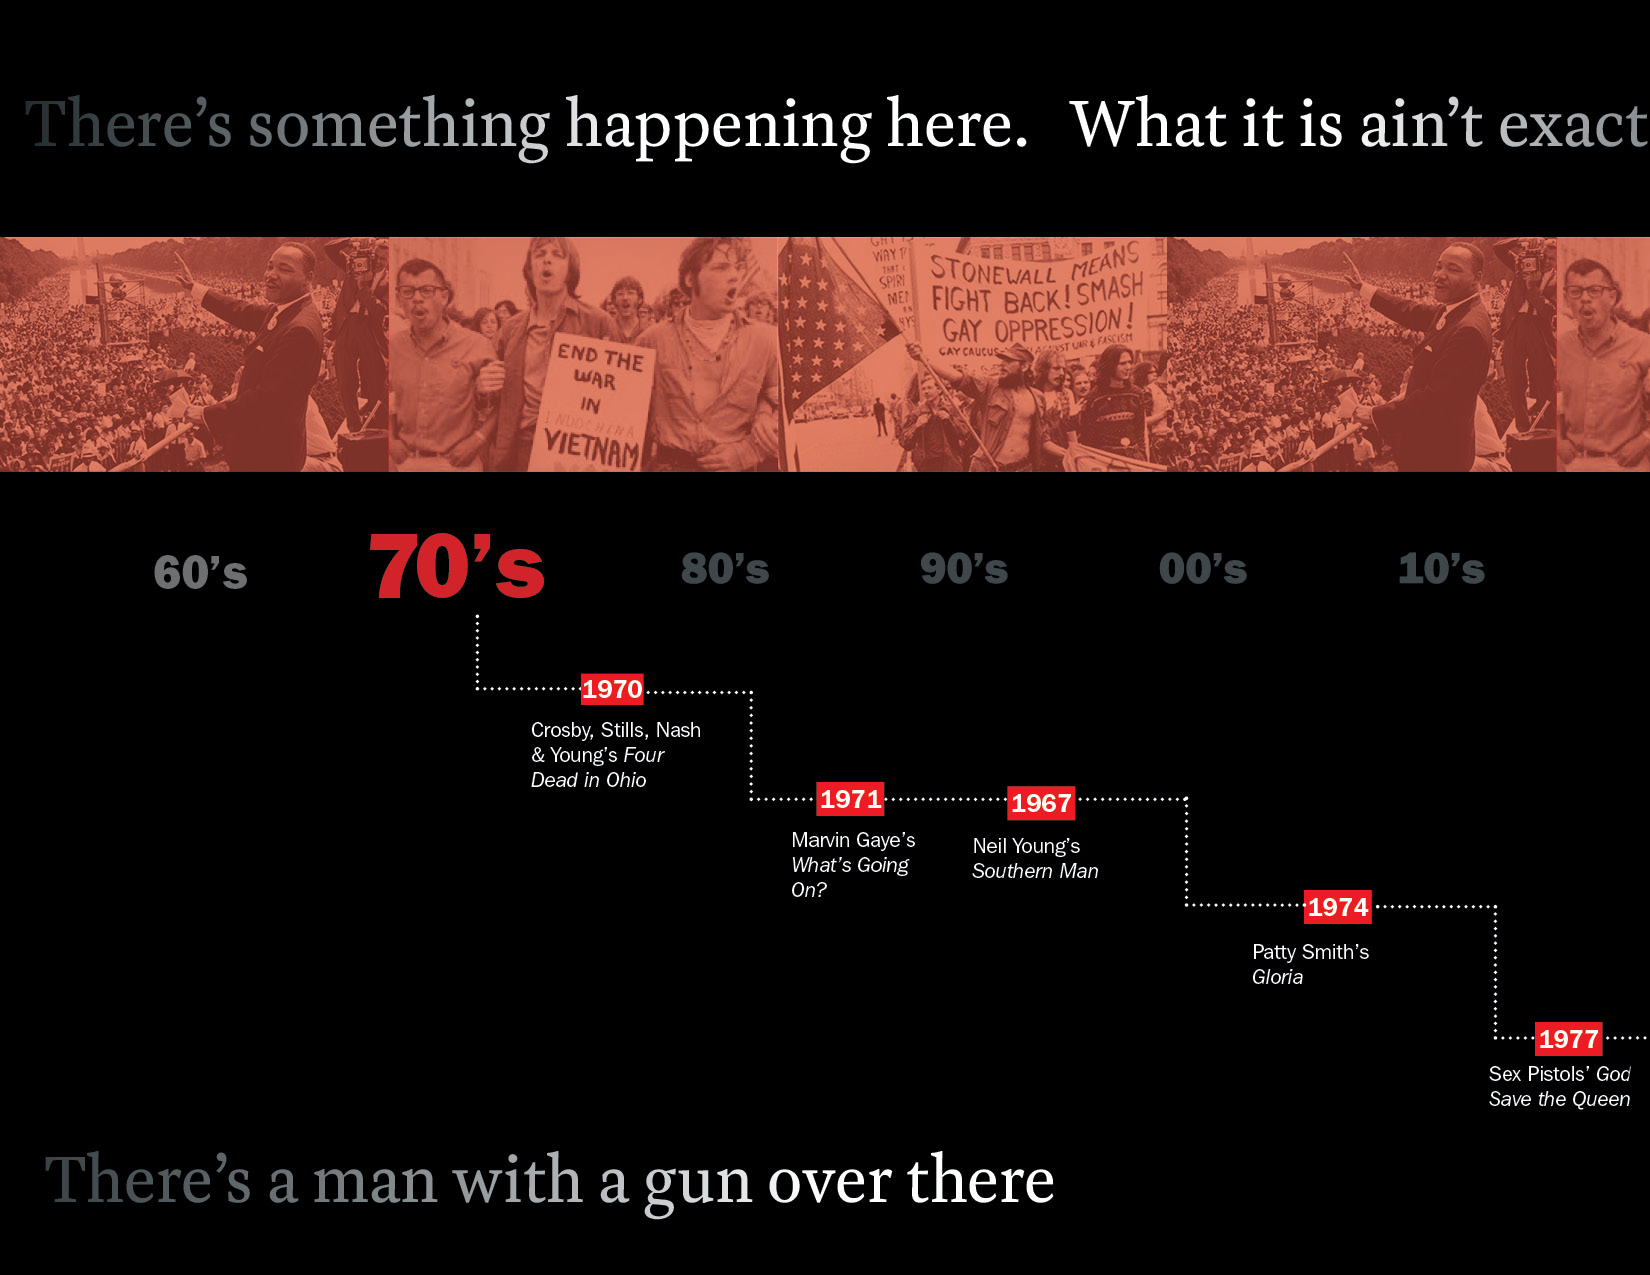
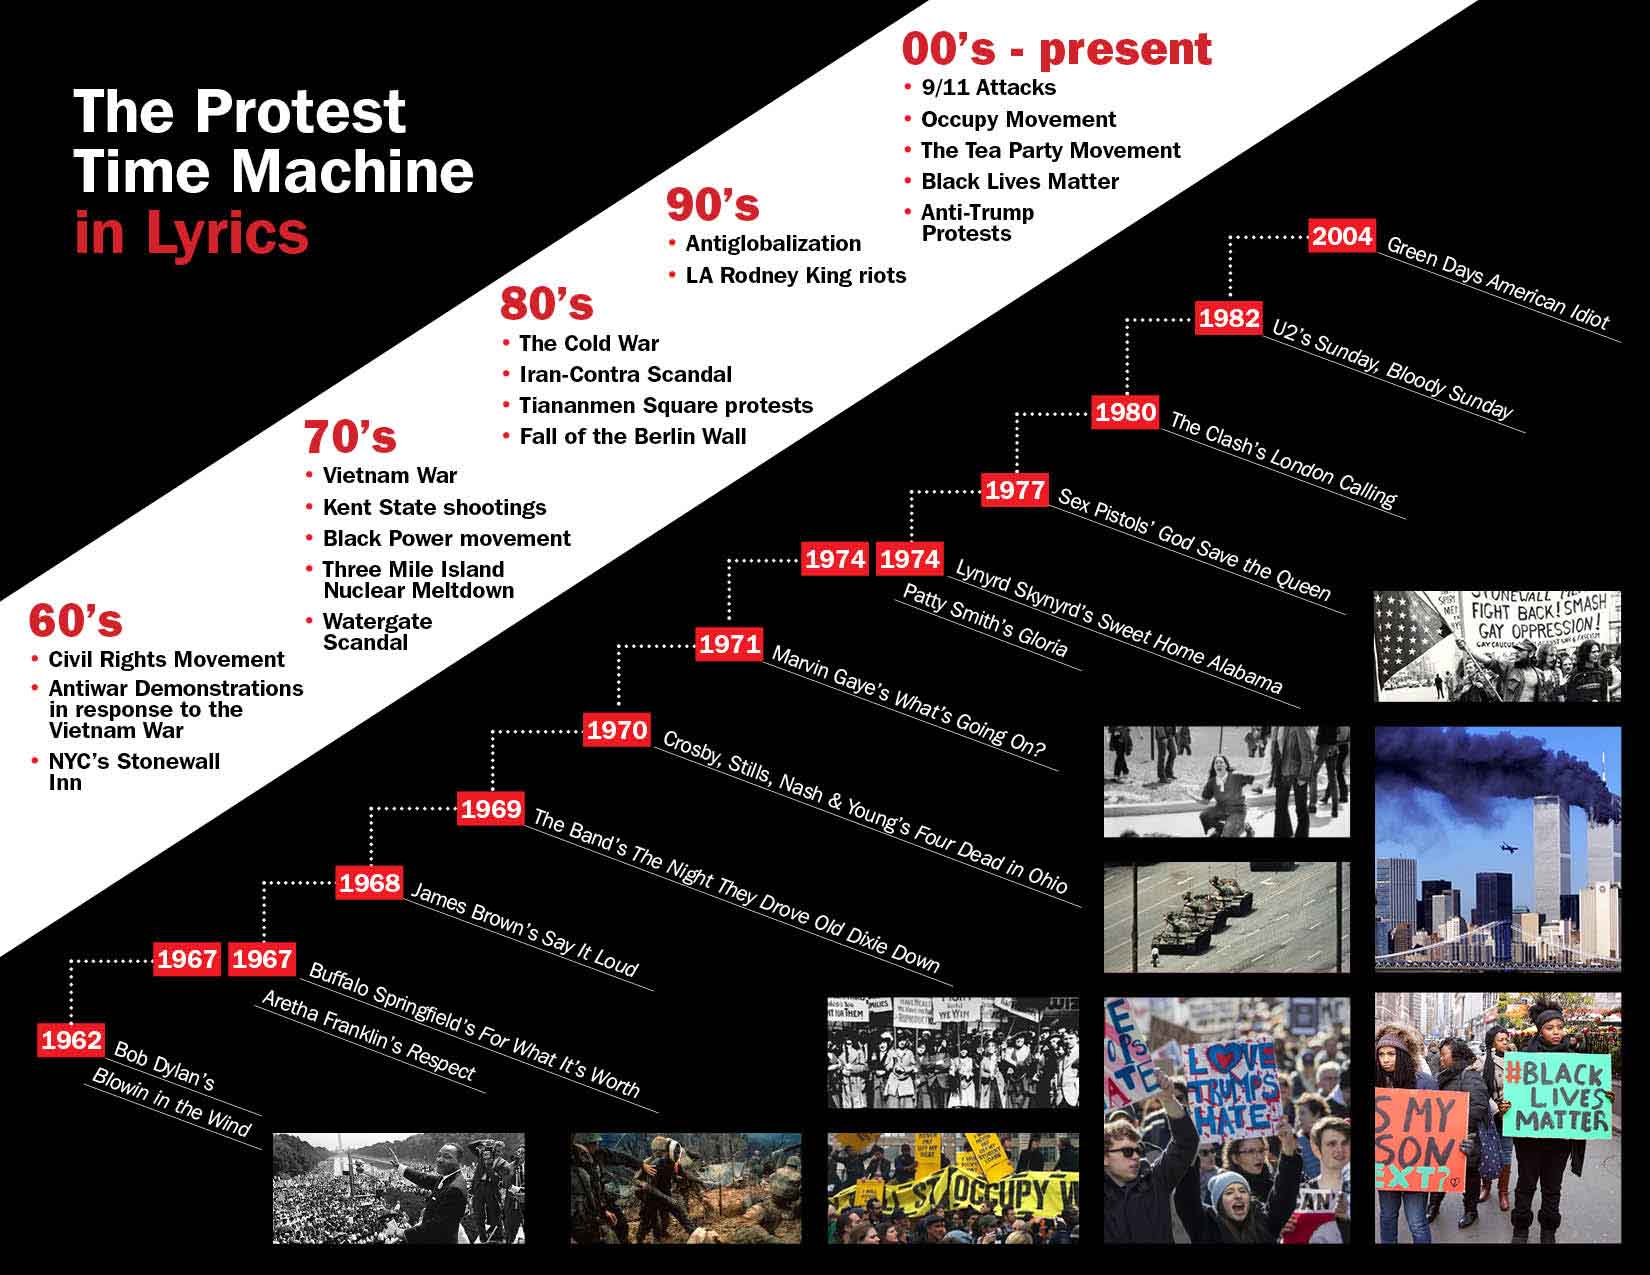
The Protest Time Machine
DESCRIPTION:
A timeline of selected protest and political songs from the 1960s to present time to remind ourselves of what people have been fighting for then and now. Music brings people together and this small collection of songs are examples of the frustration and disappointment in an event and is a call to bring awareness and challenge in a creative and constructive way.
PROCESS:
1) Inspiration: The concept for this project was inspired by a couple of things. First, the results of the 2016 election were surprising and disappointing to many with anti-Trump marches going on across the country to the protests of the Dakota Access oil pipeline. I also was inspired by what was going on in my part-time job. I’m currently designing a Rock N’ Roll bookazine and after reading the chapter on protest and political songs, I wanted explore this content further and to try to create a p5 sketch that could be an extension of the print form, where you would be able to listen to these songs in one place as you read along.
2) Data Collecting: To help me collect all the content, links to YouTube video links, wikipedia description, songs, I kept track of everything in the this excel document below.
3) Design and Coding: I found it helpful to throw all the elements into a Indesign layout program to figure out my design and how to organize the content. It became my blueprint for when I started coding and also held all the data together, so I could copy and paste data quickly.

4) Next Steps: There is so much more that I want to do with this that I didn’t get to, but I’m very happy to have a base that I can build on. The main thing that I would like to do is to make the design less static and more interactive by highlighting photos, videos and caption description from that particular moment in history. While researching and collecting these songs, I not only learned more about the history of that time period, but discovered all these side stories behind the songs and I want to focus on that part of the sketch next. I also used this concept of the protest time machine for my PCOM project, but kept the projects separate because there so much of coding that I still do not have a good grasp on and this project was a good exercise on implementing what we have been learning or are still trying to grasp. But from the feedback of my PCOM project, I saw the need to compare and contrast songs from a certain year or particular cause, like comparing the songs from the Civil Rights era to what is going on with Black Lives Matters decades later and would like to figure out how to code functions like that. And I need to fix small things like having the text scrolling to be in sync with the song playing and to make the play buttons more visual, along with improving the functionality. Lots to learn (and revisit) over the break till the next semester starts again.
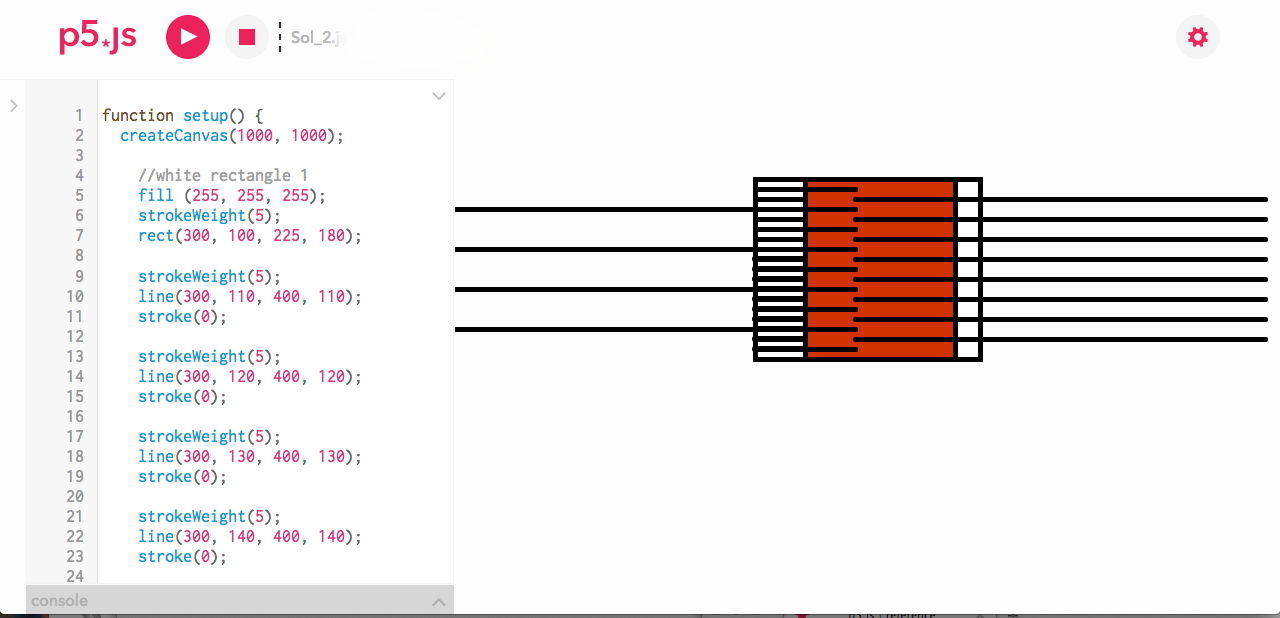
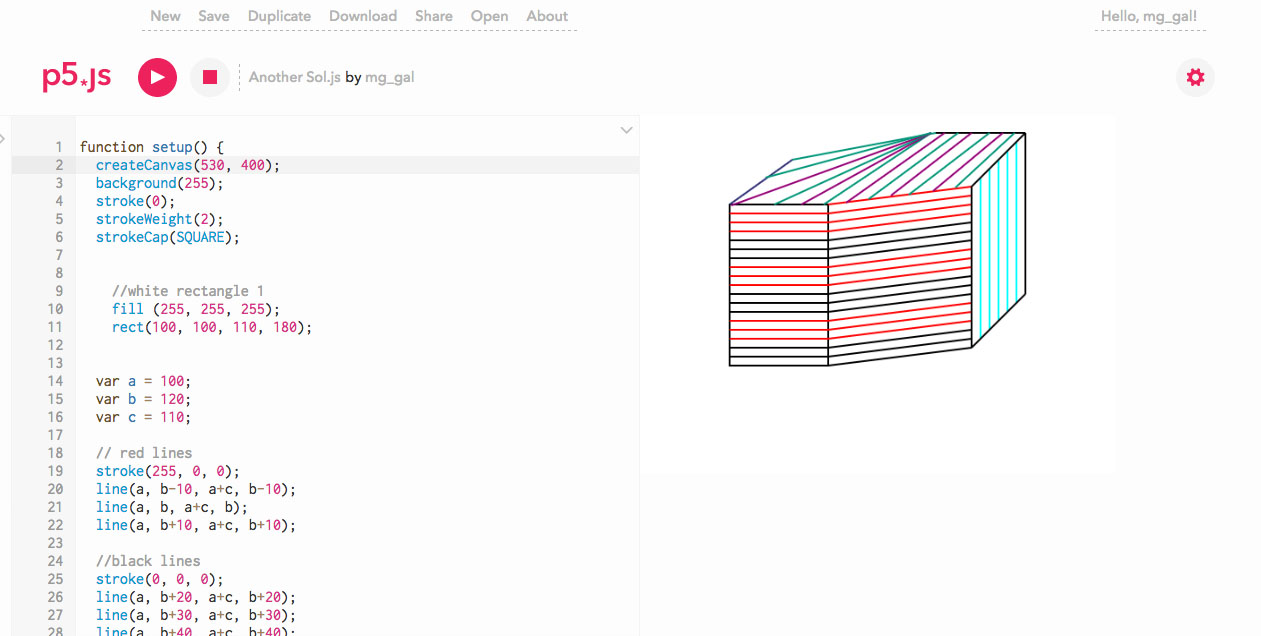
CODE
 closeup of the circuit and breadboard
 user testing
You must be logged in to post a comment.