TITLE: Case by Case
DESCRIPTION: Nature of Code final project that distinguishes lowercase letters from uppercase letters for little kids to use. The idea was inspired by a children’s app called Endless Wordplay and from a parent-teacher meeting for my 3-year old. His teacher informed me that he was really good at identifying uppercase letters, but not lower case letters. In preparation towards the next steps of reading, deciphering lowercase letters is something that we needed to work on since most of reading is strings of lowercase letters. And for myself, in effort to grasp the idea of neural networks and machine learning, I decided to work with Shiffman’s neural network of handwritten numbers using the MNIST database and apply letters to his sketch. Eventually, I would like to apply that model to identify letters and numbers in graphic illustrations, photos and different typefaces.
————
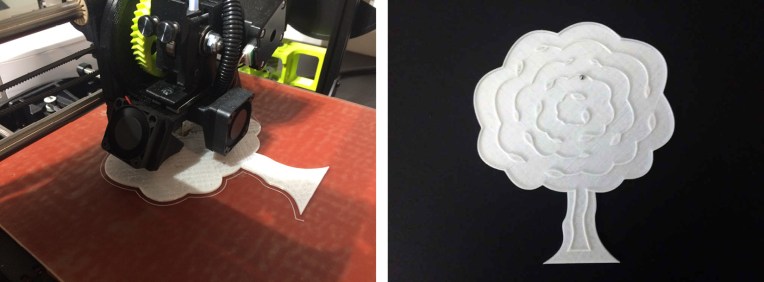
MOCKUP:

DOCUMENTATION:
1) In building upon Daniel Shiffman’s Neural Network example from Nature of Code, which was also based on Tariq Rashid’s Make Your Own Neural Network, I want to use a training set of handwritten letters to distinguish between upper and lowercase letters as an initial step. I eventually want to take photos or illustrations of letters and numbers, similar to pieces in 36 Days of Type below, and teach the neural network to identify the letter or number.

36 DAYS OF TYPE
2) Converting a test image of a number illustration into a bitmap file to add to the training set. Converted the test image into a 28 x 28 pixel greyscale image in Photoshop and then used Python to extract the pixel values from the photo illustration.
from PIL import Image
im = Image.open('um_000000.png')
pixels = list(im.getdata())

(SOURCE)

3) Creating the upper and lowercase training set, adding that to the data folder and build…


You must be logged in to post a comment.